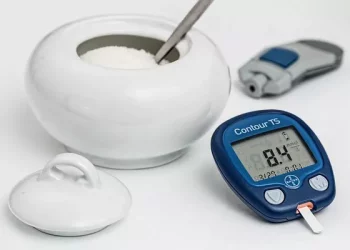
Monitoring blood sugar levels is a vital aspect of managing diabetes. It provides valuable insights into how your body processes glucose and helps you make informed decisions about your diet, exercise, and medication. Understanding what a normal blood sugar chart looks like can help individuals with diabetes maintain stable blood sugar levels and prevent complications. This article explores the components of a normal blood sugar chart, factors influencing blood sugar levels, and best practices for monitoring.
Understanding Blood Sugar Levels
Blood sugar, or blood glucose, refers to the amount of glucose present in the bloodstream. Glucose is the primary source of energy for the body’s cells, and maintaining balanced blood sugar levels is crucial for overall health.
Blood Sugar Regulation
Role of Insulin
Description: Insulin is a hormone produced by the pancreas that regulates blood sugar levels. It facilitates the uptake of glucose into cells, lowering blood sugar levels.
Function: When blood sugar levels rise after eating, the pancreas releases insulin to help cells absorb glucose. Conversely, when blood sugar levels drop, insulin secretion decreases.
Homeostasis
Description: The body strives to maintain stable blood sugar levels through a process called homeostasis. This involves hormonal regulation and feedback mechanisms.
Purpose: A stable blood sugar level is essential for proper cellular function and overall health.
Normal Blood Sugar Ranges
Normal blood sugar levels can vary based on factors such as the time of day, meals, and individual health conditions. The following chart outlines typical blood sugar ranges:
Fasting Blood Sugar: This measurement is taken after an overnight fast (at least 8 hours without food). A fasting blood sugar level below 100 mg/dL is considered normal.
Postprandial Blood Sugar: This measurement is taken 2 hours after eating. A postprandial level less than 140 mg/dL is considered normal.
Random Blood Sugar: This measurement can be taken at any time. Levels less than 200 mg/dL are generally considered normal.
Components of a Normal Blood Sugar Chart
A normal blood sugar chart visually represents an individual’s blood glucose levels over time. Here are the key components of a normal blood sugar chart:
1. Time Frame
Description: The time frame of the chart may vary. Common intervals include daily, weekly, or monthly readings.
Purpose: Tracking blood sugar levels over time helps identify patterns and fluctuations.
2. Measurement Units
Description: Blood sugar levels are usually measured in milligrams per deciliter (mg/dL).
Purpose: Standardized units facilitate comparisons and help healthcare professionals assess blood sugar control.
3. Baseline and Target Levels
Description: Normal blood sugar levels are indicated on the chart, often represented by a shaded area or reference lines.
Purpose: Establishing baseline and target levels helps individuals recognize when their blood sugar is within the normal range or elevated.
4. Data Points
Description: Each data point on the chart represents a blood sugar measurement taken at a specific time.
Purpose: Data points help visualize trends and variations in blood sugar levels.
5. Graphical Representation
Description: Blood sugar levels are often represented using line graphs, bar charts, or scatter plots.
Purpose: Graphical representations make it easier to identify patterns, peaks, and troughs in blood sugar levels.
Interpreting a Normal Blood Sugar Chart
1. Identifying Patterns
Stable Levels: Consistent readings within the normal range indicate good blood sugar control.
Fluctuations: Significant spikes or drops may suggest dietary indiscretions, stress, or medication issues.
2. Analyzing Postprandial Levels
Postprandial Spikes: Analyzing blood sugar levels after meals helps assess how well the body processes glucose.
Target Levels: A postprandial reading below 140 mg/dL is ideal for individuals without diabetes.
3. Understanding Fasting Levels
Fasting Blood Sugar: Monitoring fasting blood sugar levels helps assess overall glucose metabolism.
Target Range: A fasting blood sugar level below 100 mg/dL is desirable.
4. Recognizing Hypoglycemia and Hyperglycemia
Hypoglycemia: Blood sugar levels below 70 mg/dL may indicate hypoglycemia, requiring immediate intervention.
Hyperglycemia: Levels above 130 mg/dL before meals or above 180 mg/dL after meals may indicate hyperglycemia, necessitating adjustments in diet or medication.
Factors Influencing Blood Sugar Levels
Several factors can affect blood sugar levels, making it important to consider these when interpreting a blood sugar chart.
1. Diet
Carbohydrate Intake: Foods high in carbohydrates can lead to increased blood sugar levels, especially simple sugars.
Meal Timing: Eating regular meals and snacks helps maintain stable blood sugar levels.
2. Physical Activity
Exercise Impact: Physical activity increases insulin sensitivity, leading to improved blood sugar control.
Activity Timing: Timing of exercise in relation to meals can affect blood sugar levels.
3. Medications
Insulin: For individuals with Type 1 diabetes, insulin administration is crucial for managing blood sugar levels.
Oral Medications: Various oral medications can help control blood sugar in individuals with Type 2 diabetes.
4. Stress
Stress Hormones: Stress triggers the release of hormones like cortisol, which can increase blood sugar levels.
Management Techniques: Stress management strategies, such as relaxation techniques and mindfulness, can help regulate blood sugar.
5. Illness or Infection
Illness Impact: Illness can increase stress hormones and inflammation, leading to elevated blood sugar levels.
Monitoring During Illness: It’s essential to monitor blood sugar closely during periods of illness or infection.
Best Practices for Blood Sugar Monitoring
Monitoring blood sugar levels effectively is crucial for managing diabetes. Here are some best practices for blood sugar monitoring:
1. Use a Reliable Glucose Meter
Calibration: Ensure that your glucose meter is calibrated correctly for accurate readings.
Regular Maintenance: Keep the meter clean and replace test strips as needed.
2. Monitor at Consistent Times
Timing: Monitor blood sugar levels at consistent times, such as before meals and 2 hours after eating.
Purpose: Consistent timing helps identify patterns and trends.
3. Keep a Blood Sugar Log
Recording Readings: Maintain a log of blood sugar readings, meal times, and any relevant notes about diet or exercise.
Purpose: A log helps track progress and provides valuable information for healthcare providers.
4. Understand How to Respond to Readings
Action Plans: Develop action plans for high and low blood sugar levels, including dietary adjustments or medication changes.
Consultation: Work with healthcare professionals to establish personalized response strategies.
5. Educate Yourself
Understanding Diabetes: Educate yourself about diabetes management, including dietary choices and lifestyle changes.
Resources: Utilize educational resources, diabetes management apps, and support groups for guidance.
See also: What is the Fastest Way to Fix Prediabetes?
Conclusion
Understanding what a normal blood sugar chart looks like is crucial for effectively managing diabetes. By monitoring blood sugar levels regularly and recognizing patterns, individuals can make informed decisions about their diet, exercise, and medications.
Maintaining blood sugar within the normal range requires a holistic approach that includes healthy eating, physical activity, and regular monitoring. By adhering to best practices for blood sugar monitoring and understanding the factors that influence blood sugar levels, individuals with diabetes can achieve better health outcomes and improve their quality of life.
In summary, a normal blood sugar chart serves as a valuable tool for managing diabetes. It provides insights into how well blood sugar levels are controlled over time and helps identify areas for improvement. By staying informed and proactive, individuals can effectively manage their diabetes and lead healthy, fulfilling lives.
Related topics:
What Is the Minimum Glucose Level in Blood?


